

The Stacktape Console becomes your operations hub the moment you deploy a stack. It gives you a central place to inspect deployments, view costs once reports arrive, manage secrets, and — with minimal setup — monitor alarms, track runtime errors, and receive alerts. The stack you deployed in the previous step is already visible here.
Already familiar with the Console? Skip ahead to CI/CD to set up automated deployments.
The Overview dashboard
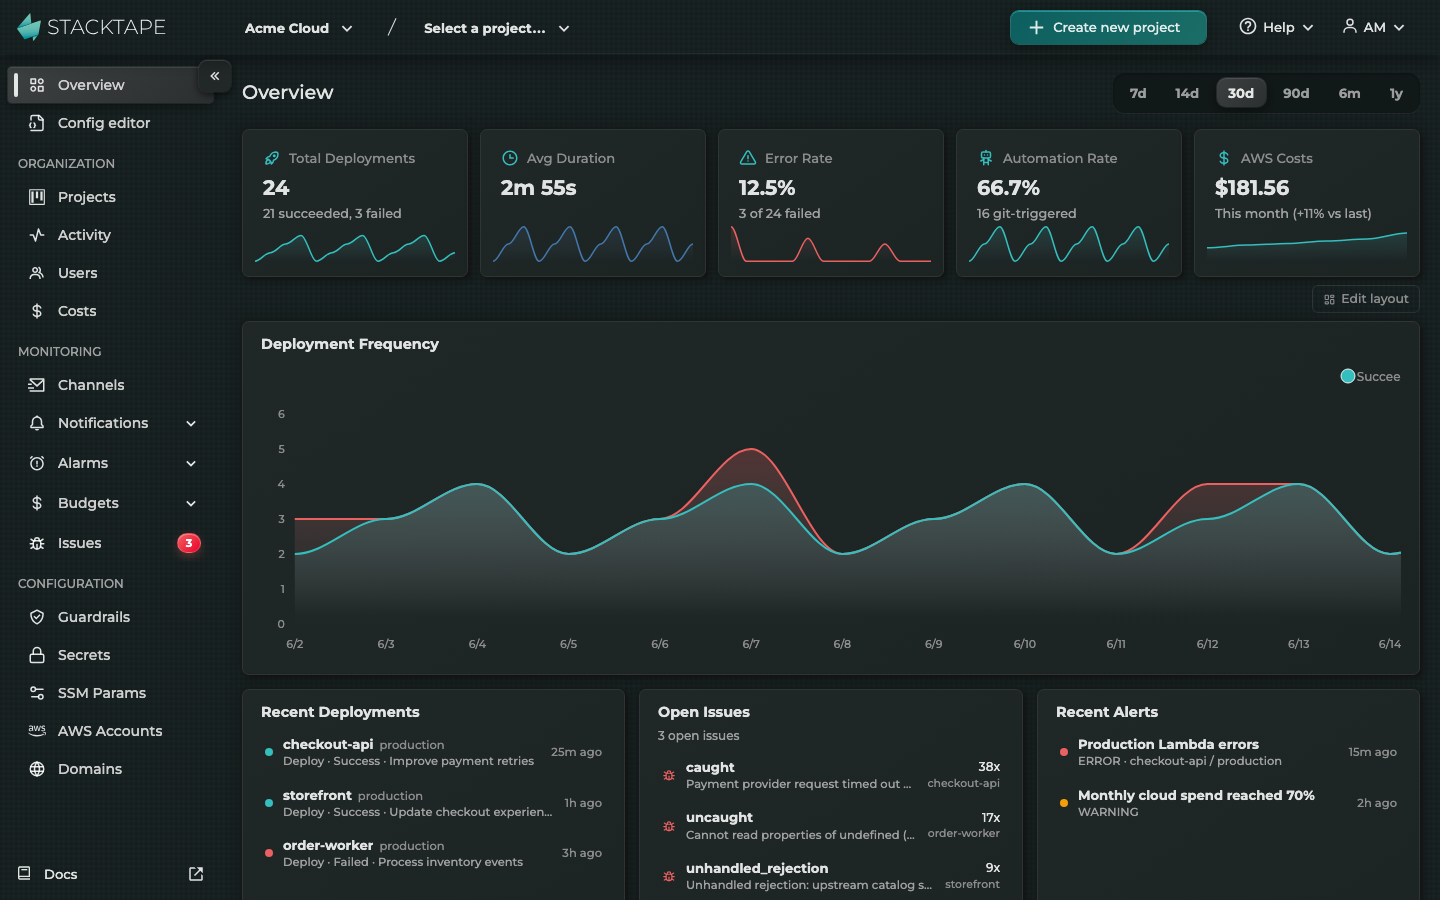
The Overview page is the Console's default landing route. After your first deployment, it shows KPI cards for total deployments, average duration, error rate, automation rate, and AWS costs — all with sparkline trends. Below the KPIs, a gadget grid displays deployment frequency charts, recent deployments, open issues, recent alerts, cost breakdowns by project and by resource type, budget status, and automation ratio. Use the time range selector (7d, 14d, 30d, 90d, 6m, 1y) at the top right to adjust the window.
Key items — recent deployments, open issues, recent alerts, and budget alerts — link through to their respective detail pages, making the Overview your daily check-in surface. If you have no deployed stages yet, the Console shows a getting-started guide instead.
Logs
Use stacktape logs for CLI log access. See Observability — Logs for the detailed workflow including log querying, filtering, and forwarding to external services.
Metrics
Use stacktape metrics for CLI-based metric queries. See Observability — Metrics for the detailed metric reference.
Alarms
Alarms are defined in your Stacktape configuration, in the alarms list of a resource such as a Lambda function, database, HTTP API Gateway, Application Load Balancer or SQS queue. Stacktape creates the CloudWatch alarms when the stack is deployed. The Alarms page in the Alerting group shows the current state of the CloudWatch alarms in your connected AWS accounts, and stacktape alarm list shows the state from the CLI.
An alarm sends to the notificationChannels listed on it, such as Slack, email or a webhook. A firing alarm also opens an incident, which a notification rule can send to a Console alert channel. Alarm rules created in the Console earlier are legacy; they are listed under Legacy alarm rules on the Alarms page, and stacktape alarm export moves them into your configuration. See Observability: Alarms for the full setup guide.
Error tracking
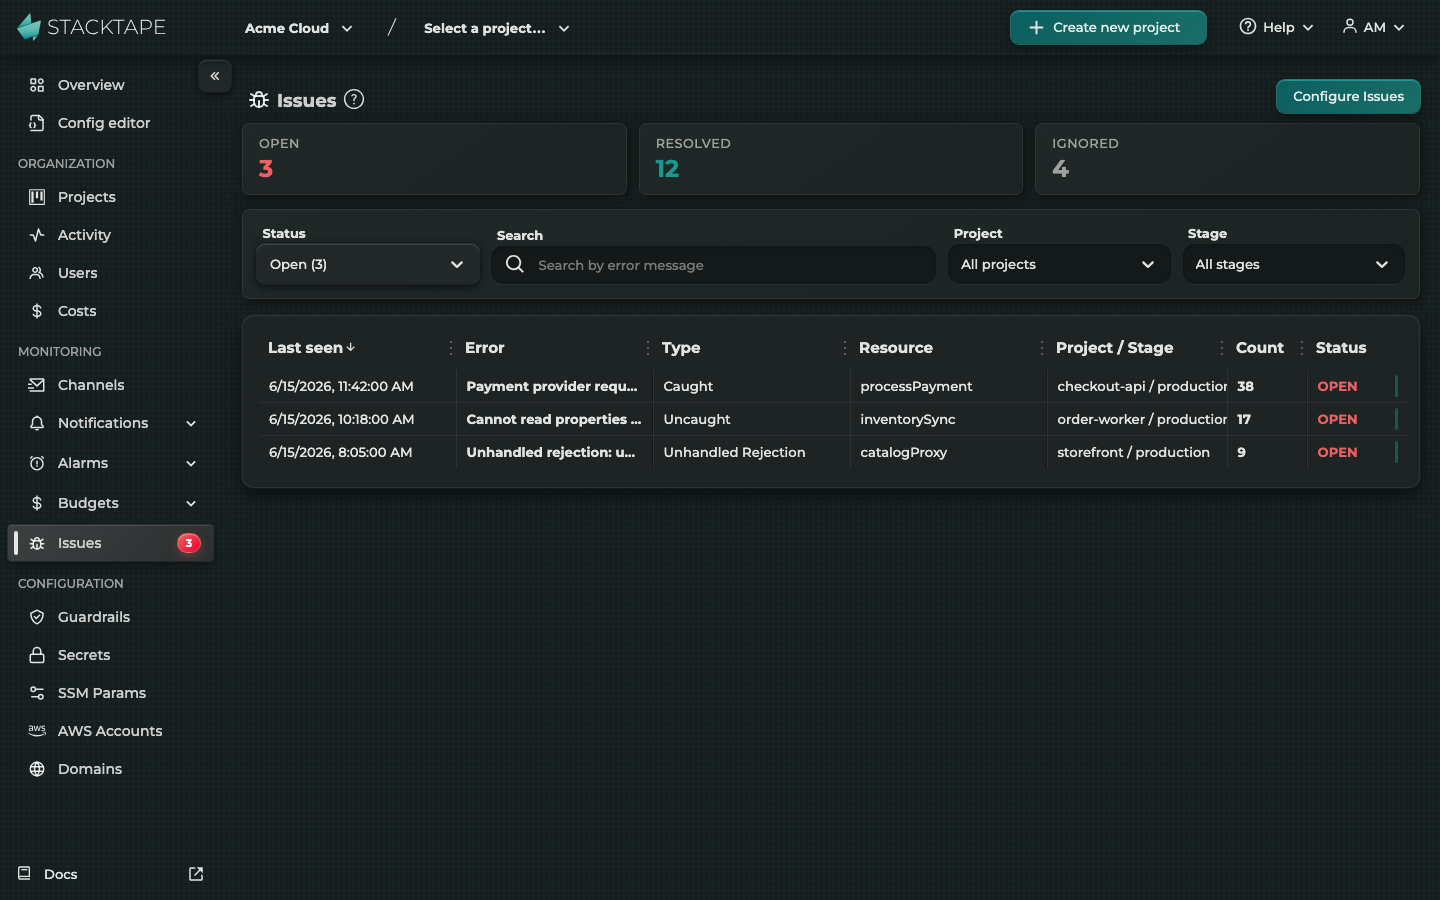
The Error tracking page in the Observability group is a built-in error inbox. Stacktape reads runtime errors from the logs of your functions and containers and groups repeated occurrences into one issue per distinct error and resource, with the error message, project, stage, function name, occurrence count and last-seen time.
Error tracking is on for every stage of every stack by default. Nothing needs to be set up: each deployment subscribes the stack's log groups to Stacktape's error detector, and errors appear within a minute of being logged. A stack turns it off or limits it to some stages with deploymentConfig.errorTracking. Issues can be filtered by status (All, Open, Resolved, Ignored), project, stage and search text.
Detection is log-pattern based, not a full APM trace. It catches most recurring runtime failures but can miss errors that don't match standard patterns. Keep a dedicated tracing or APM tool when you need custom context, release tracking or client-side error capture. See Observability: Error tracking for configuration details and the CLI commands stacktape error list and stacktape error resolve.
Cost dashboards
The Costs page lists month-to-date costs per stack, with project, stage, and AWS region shown for each row. You select an AWS account and a month to see month-to-date costs per stack, then open a stack's costs page from the table row for more detail. Reports are generated daily from AWS Cost and Usage Reports and can take a while before they are available.
The Overview dashboard also surfaces costs by project and by resource type for a quick spend overview. See Managing Costs — Dashboards and Managing Costs — Budgets to set up spending alerts.
Secrets management
The Secrets page lists AWS Secrets Manager secrets and lets you create, show, update, and delete them. The page asks you to choose an AWS account and AWS region before listing or changing secrets. Reference secrets with $Secret() in your Stacktape configuration — the secret value stays in AWS Secrets Manager instead of being committed to your config file or version control. See Configuration — Secrets for the runtime details.
You can also manage secrets from the CLI with stacktape secret set, stacktape secret get, and stacktape secret delete. See Configuration — Secrets for the full workflow.
Quick reference
A deploy gives the Console enough stack metadata to show deployments, costs (when reports arrive), and stack-scoped operational views. Some features require additional setup: define alarms in your configuration, create alert channels, and manage secrets separately.
| Feature | Where in Console | CLI equivalent | Setup required |
|---|---|---|---|
| Deployments | Overview | stacktape stack history | None — shown when deployed stages exist |
| Logs | — | stacktape logs | None |
| Metrics | — | stacktape metrics | None |
| Alarms | Alerting → Alarms | View state: stacktape alarm list | alarms on resources in the config + alert channel |
| Error tracking | Observability → Error tracking | stacktape error list | None, on by default |
| Costs | Organization → Costs | — | None — reports arrive daily |
| Secrets | Configuration → Secrets | stacktape secret set | Connected AWS account + AWS region selection |
Next step
Your stack is deployed and observable. The next step is automating deployments so every push to your main branch triggers a redeploy — and pull requests get their own preview stages.