

The Stacktape Console provides two cost views: a high-level overview with KPI cards and charts on the organization dashboard, and a detailed per-stack cost breakdown on the dedicated Costs per stack page. Both views use AWS cost report data, which is generated daily.
This page covers viewing your AWS costs. For setting up spend alerts, see Budgets. For understanding which individual resources cost the most, see Per-resource breakdown. For reducing costs, see Optimization tips.
Organization overview
The organization overview dashboard includes cost-related KPI cards and charts alongside deployment and operational metrics. Cost data on the overview always reflects the current calendar month — the time range selector (7d, 14d, 30d, 90d, 6m, 1y) controls deployment statistics only, not cost views. The cost widgets give you a quick read on total spend, spend distribution, and budget status without navigating to the dedicated costs page.

AWS Costs KPI
The AWS Costs KPI card displays your total spend for the current month with a month-over-month trend indicator. The trend compares current spend against the previous month's total and displays one of these labels:
| Trend label | Meaning |
|---|---|
+X% or -X% | Percentage increase or decrease vs the previous month |
Flat | 0.1% change or less in either direction |
New spend | Spend this month with a previous-month total of zero |
No spend | Zero spend in both the current and previous month |
A sparkline below the card shows a recent monthly cost trend, giving you a quick visual of whether spend is rising or falling. The subtitle reads "This month" and includes the trend label for context.
AWS Costs by Project
A horizontal bar chart titled "AWS Costs by Project" displays up to 10 items sorted by current-month spend. If more than 10 items have costs, the remainder is grouped under "Other." Hover over any bar to see the exact amount and name. This chart helps you identify which applications drive the largest share of your bill at a glance.
AWS Costs by Resource
A separate horizontal bar chart titled "AWS Costs by Resource" breaks down current-month spend by AWS resource type. This view is useful for identifying which resource types drive your bill, independent of which project uses them. If a particular resource type suddenly spikes, you know where to start investigating — even before checking which project is responsible.
Budgets
The Budgets row on the overview shows how many budgets you have. When budgets are over their limit or forecast to go over it this month, the row turns red and counts those budgets instead. Snoozed budgets are not counted as over. Click the row to open the Budgets page.
Costs per stack
The dedicated Costs per stack page provides a month-by-month table of AWS spend attributed to each deployed stack. You select an active connected AWS account and a month, and the table shows every stack with its project name, stage, region, and total attributed cost for that period.
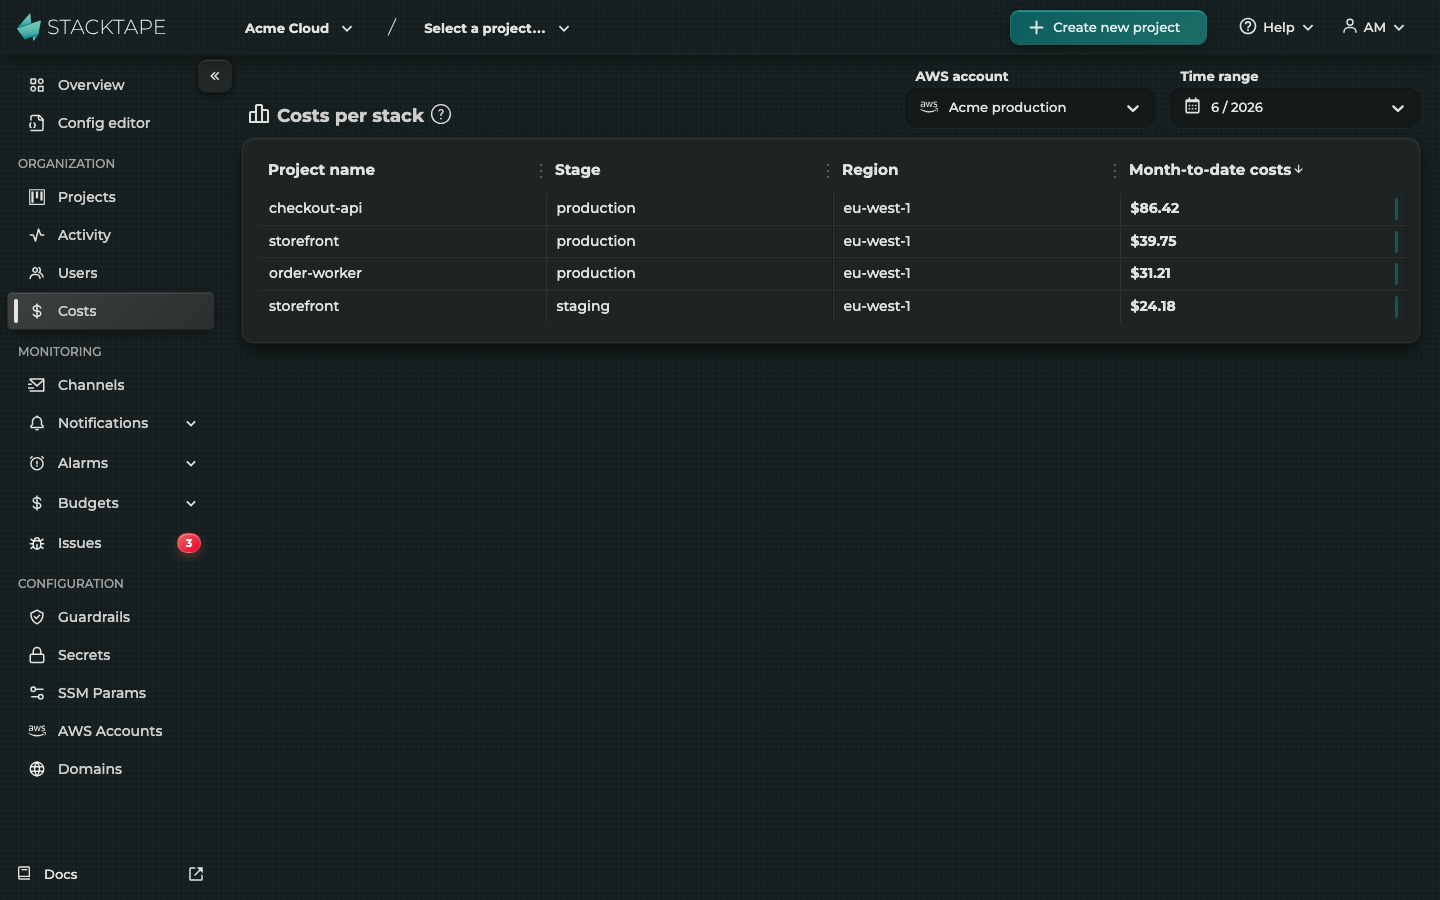
Filters
Two filters at the top of the page control the displayed data:
- AWS account — select from your active connected AWS accounts. Switch between accounts to compare spend across different AWS environments.
- Time range — select a month. The selector includes each month so far in the current year plus all 12 months of the previous year — between 13 and 24 selectable months depending on when in the year you view it.
Cost table
The table shows one row per stack with the following columns:
| Column | Description |
|---|---|
| Project name | The Stacktape project the stack belongs to |
| Stage | The stage name (e.g., production, staging) |
| Region | The AWS region the stack is deployed in |
| Month-to-date costs | Total attributed spend for the selected month |
The table sorts by cost descending by default and paginates at 10 rows per page. Clicking a row opens a per-resource cost breakdown for that stage — see Per-resource breakdown for a walkthrough of that view and Optimization tips for guidance on acting on the findings.
Cost Dashboards FAQ
How often is cost data updated?
Cost reports are generated daily and may not be available immediately after a new deployment. Reloading the page fetches the latest available report data.
Does Stacktape add any markup to AWS costs?
No. AWS infrastructure costs are billed directly to your AWS account, and the dashboards show those charges as-is. Stacktape's subscription fee is separate and does not appear in these dashboards. See Billing and subscription for subscription details.
How is this different from the AWS Billing console?
The AWS Billing console shows account-wide cost data. The Stacktape Console attributes costs to your specific projects, stages, and regions, so you can see per-stack spend directly without slicing through raw billing data.
Can I set up alerts when costs exceed a threshold?
Yes. A budget sets a monthly limit for one connected AWS account and alerts your channels when actual or forecasted spend crosses percentages of it. See Budgets for setup details.
How far back can I view cost history?
The time range selector on the Costs per stack page includes each month so far in the current year plus all 12 months of the previous year. This gives you between 13 and 24 selectable months depending on when in the year you view it.
Can I compare costs across multiple AWS accounts?
Yes. If you have multiple active connected AWS accounts, use the AWS account dropdown on the Costs per stack page to switch between them. Each account's cost data is displayed independently — select a different account to compare spend across environments.