

Stacktape error tracking is a built-in error inbox available on the Error tracking page of the Stacktape Console and in the CLI. It displays recorded runtime errors with each issue's status, error message, error type, occurrence count, function name, and originating project and stage. Manage issues without integrating a third-party error tracking service.
Use stacktape error list, error resolve, error ignore, and error reopen to manage recorded errors from the CLI. Configure capture with deploymentConfig.errorTracking. Each recorded error group is called an issue.
Migrating to v4
The issues:* commands are now error list, error ignore, error resolve, and error reopen. The old commands still work, so existing scripts and MCP command requests keep running. Rename deploymentConfig.issues to deploymentConfig.errorTracking in YAML and TypeScript configs; the old config name is rejected. Issue IDs and status values stay the same.
When to use
Stacktape error tracking gives you structured error tracking with no additional SDK or external service. It is on by default and fits when:
- You want to see which runtime errors are recurring across projects and stages without scanning raw log lines.
- You need a lightweight triage workflow — open, resolve, or ignore issues — without leaving Stacktape.
- You want occurrence counts and error classification grouped per issue, not scattered across individual log entries.
Error tracking works well as a first line of error visibility. For most teams shipping APIs and background workers on Stacktape, it replaces the need for a separate error tracking tool during early and mid-stage development.
Resources configured with logging.logClass: infrequent-access do not feed error tracking because AWS does not support the required log subscription filters. Their logs remain available through bounded Logs Insights snapshots in the Console and CLI.
When NOT to use
Stacktape error tracking displays recorded runtime errors in the Console and CLI without requiring you to add an SDK to your application. It does not instrument your application process directly. If you need breadcrumbs, custom tags, user session tracking, release tracking, or performance profiling, use a dedicated APM tool like Sentry or Datadog alongside or instead of it. Error tracking is best for triaging recurring runtime failures — not for full-stack observability.
Turning error tracking off or limiting stages
Error tracking is on for every stage of every stack by default. Nothing needs to be set up: each deployment subscribes the stack's function and container log groups to Stacktape's error detector, and errors appear on the Error tracking page within a minute of being logged.
The stack's configuration decides. Turn error tracking off for a stack, or limit it to some stages, in deploymentConfig.errorTracking; the change takes effect at the stack's next deployment.
The Console has one organization-wide switch as well. Click Settings on the Error tracking page to open Error tracking settings; organization owners and admins can turn error tracking off and on there. While it is off, no error events are recorded for any stack. The same dialog lists the deployed stacks and whether their last successful deployment wired error tracking, so you can see which stacks still run an older CLI.
What leaves your AWS account
For each detected error, the detector running in your account sends the error message and type, the parsed stack frames, the matching log line (a few kilobytes at most), the request id and, for a Lambda function, the version its execution environment ran and the time that environment started. It also sends where the error happened (project, stage, region, function name and log group) and how many occurrences the report stands for. Logs themselves stay in your account.
Before sending, known shapes of sensitive text are masked: secrets and tokens (AWS keys, GitHub, Stripe, Slack and Google tokens, JWTs, private key blocks), values under sensitive key names such as password, token or authorization, credentials in URLs, email addresses (the domain stays), IP addresses, card numbers and user home directories in file paths. Masked text reads [redacted:email], [redacted:secret] and so on. The Console masks the same shapes again on arrival. Names, street addresses and phone numbers are not detected, because those patterns would also match ids and timestamps in log lines.
During an error storm the detector reports each distinct error once per log batch with its occurrence count, and the Console stores a few occurrence samples per issue per minute. Occurrence counts stay exact.
Stack traces of bundled JavaScript
A JavaScript or TypeScript function packaged with js-bundle runs minified code, so the frames the runtime logs point into the bundle (/var/task/index.js:1:4821). Its source maps are not in the deployment package: each deployment stores them in the stack's deployment bucket and tells the Console which maps describe the code each function runs from when.
When an issue is first seen, the Console reads the maps of the code that threw. It picks them by the version the failing execution environment ran, or, for $LATEST, by the time the environment started, so an error from an environment started before a later deployment, or from a version an alias still routes traffic to, gets the maps of its own code. It reads them through your connected account's role, limited for that session to the stack's source maps and the function's configuration and tags. The issue's detail page then shows the stack trace in your source files, with the original file, line and function.
The maps contain no source code. The Console stores the mapped file, line, column and function of each frame and keeps nothing else from the maps. Lambda logs in CloudWatch still show the bundled positions. To have Node.js map those as well, set keepSourceMapsInPackage; the Console then shows the frames as Node.js logged them.
Stack traces are mapped for errors from code deployed by the current CLI; errors from earlier deployments show the bundled positions.
Error types
The detector classifies each error. The Console shows the classification as a plain label on the issue's detail page, while the CLI prints the raw errorType value:
errorType | Console label |
|---|---|
uncaught | Uncaught exception |
caught | Logged error |
unhandled_rejection | Unhandled promise rejection |
exit_error | Process exited |
handler_not_found | Handler not found |
panic | Panic |
If an error type is not in this table, the Console also displays the raw errorType value. Use the label to recognize similar errors at a glance. The Console supports filtering by status, search text, project, and stage; the CLI error list command supports filtering by project name, stage, issue status, and result limit.
Issue statuses
Every issue has one of three statuses. The Console displays summary cards at the top of the Error tracking page with the count for each:
| Status | Color in Console | Meaning |
|---|---|---|
| Open | Red | Active error that needs attention |
| Resolved | Green | Marked as fixed |
| Ignored | Gray | Intentionally suppressed |
The CLI has separate commands for resolving, ignoring, and reopening errors: error resolve, error ignore, and error reopen. Clicking a row in the Console navigates to the selected issue.
Viewing issues in the Console
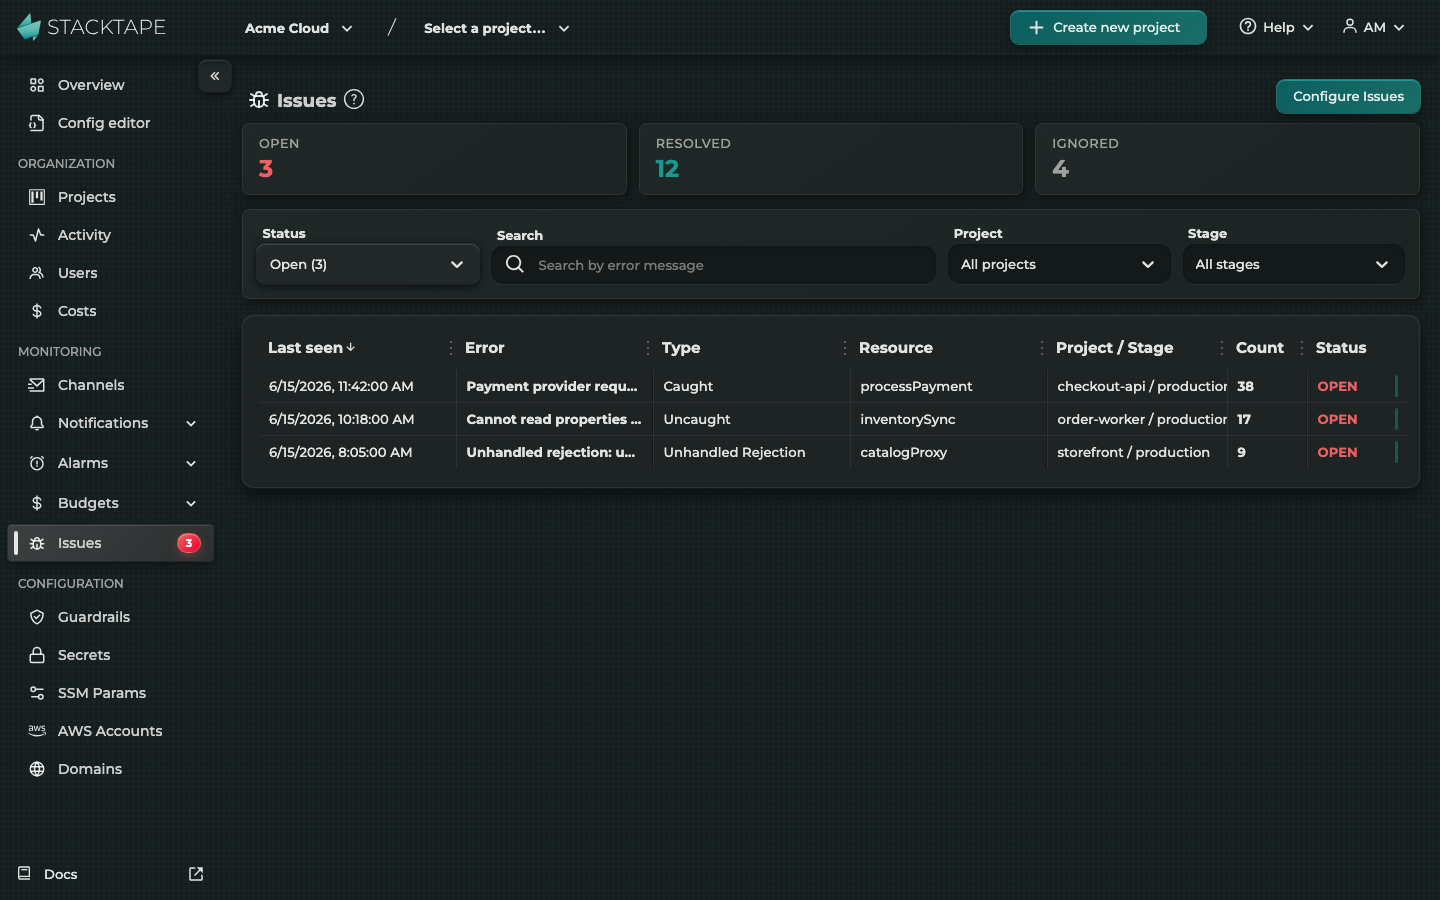
The Error tracking page in the Stacktape Console provides a filterable, paginated view of all recorded issues across your organization. Three summary cards at the top show the count of Open, Resolved, and Ignored issues at a glance.
Issue table
Below the summary cards and filters, a table lists issues with these columns:
| Column | Shows |
|---|---|
| Error | The error message, with the project, stage and function name (when available) below it |
| Events | Total occurrences of this error |
| Last seen | Time of the most recent occurrence |
| First seen | Time the issue was first recorded |
| Status | Open, Resolved or Ignored |
Clicking a row navigates to the selected issue.
Filtering
The Console provides four combinable filters that let you narrow the issue list:
- Status — All, Open, Resolved, or Ignored. Defaults to Open so you see active errors first.
- Search — Substring match against error messages. Useful for finding a specific exception type or message pattern.
- Project — Narrow results to a single project.
- Stage — Narrow results to a single stage. The dropdown includes stages from your deployed and undeployed projects plus stages found in existing issues.
The table shows 20 items per page by default and uses Last seen as the default sort column. Changing any filter resets to the first page.
Managing issues from the CLI
The Stacktape CLI provides commands for working with issues. The error list command initializes the Stacktape API client with your configured API key. In agent mode, it prints raw JSON for programmatic use in CI/CD pipelines and AI coding assistants.
Listing issues
stacktape error list displays issues as a formatted table. The default limit is 25.
Filter by project, stage, or status:
Set a custom limit:
In agent mode (used by AI coding assistants), the command outputs the raw listIssues response as JSON. The table view displays ID, status, error message, error type, function name, project, stage, occurrence count, and last seen.
Changing issue status
The CLI has separate commands for changing issue status:
Error tracking vs logs vs alarms
Error tracking, logs, and alarms serve different observability purposes. See the dedicated pages for full details on each; the summary below highlights how they complement each other:
| Error tracking | Logs | Alarms | |
|---|---|---|---|
| Purpose | Track and triage runtime errors | View raw output from functions and workloads | Alert on metric thresholds |
| Grouping | Errors grouped with occurrence counts | Individual log lines | One alarm per rule |
| Action model | Resolve, ignore, or reopen | Search and filter via logs | Triggers notifications |
| Best for | Error triage and regression tracking | Debugging specific requests | Proactive threshold monitoring |
Error tracking complements alarms: alarms tell you something is wrong (high error rate, elevated latency), while issues tell you what specific errors are happening. Configure alert channels for alarm notifications, then use the Error tracking page to diagnose which errors are driving the spike.
Limitations
- No in-process instrumentation. Stacktape error tracking does not use an in-process SDK. Errors that are silently swallowed, produce no output, or result in silent data corruption are not captured.
- False positives possible. Log lines that match error patterns but aren't actual application errors (for example, error messages logged at info level for diagnostic purposes) may be recorded as issues. Review unexpected entries before acting on them.
Error tracking FAQ
How do I turn error tracking off for a stack?
Set deploymentConfig.errorTracking.enabled: false in the stack's configuration and deploy. To keep only some stages, list them in deploymentConfig.errorTracking.stages. Organization owners and admins can also turn error tracking off for every stack at once in Error tracking settings (the Settings button on the Error tracking page).
Why aren't my issues showing up?
The log subscriptions that report errors are added during deployment, so a stack reports only after it has been deployed with Stacktape v4. Open Error tracking settings with the Settings button on the Error tracking page: it lists each deployed stack and whether its last deployment wired error tracking. Also check that the organization switch is on and that the resource does not use logging.logClass: infrequent-access.
Does issue monitoring add cost?
Very little. The detector is a Lambda function in your account that runs only when a log line matches an error pattern, and it reports each distinct error once per log batch. See Managing Costs for broader cost guidance across Stacktape features.
How is Stacktape error tracking different from Sentry or Datadog?
Stacktape error tracking is built in and does not require adding a Sentry or Bugsnag SDK to your application. Because it does not use in-process instrumentation, it provides less context than a dedicated APM tool — no breadcrumbs, no custom tags, no user session tracking, no performance traces. It also can't capture errors that are silently swallowed or produce no log output. Use error tracking for straightforward error triage; consider a dedicated APM tool if you need deep debugging context, release tracking, or performance monitoring.
What happens to existing issues when I disable monitoring?
Existing issues remain visible in the Console after monitoring is turned off — they are not deleted. You can still filter and search them; only the capture of new issues stops.
When should I use issues vs alarms for error monitoring?
Use both — they answer different questions. Alarms fire when a metric crosses a threshold (e.g., error rate above 5%), telling you something is wrong. Error tracking tells you what specific errors are happening and how often. Set up alarms with alert channels for real-time notification, then use the Error tracking page to identify which errors caused the spike and decide how to fix them.