Alarms
Alarms offer a straightforward way to monitor your infrastructure and receive prompt notifications when your resources experience issues or become overloaded.
You can configure alarms to monitor specific metrics of a resource type. When a metric crosses a predefined threshold, the alarm triggers a configured action, such as sending a notification.
Under the hood, Stacktape alarms are implemented using _CloudWatch Alarm_s.
How to create alarms
There are two ways to create alarms:
- Global alarms are created in the Stacktape Console and apply to all resources of a specific type managed by Stacktape.
- In-config alarms are defined directly within a resource's configuration in your
stacktape.ymlfile.
Global alarms
Global alarms are templates created in the Stacktape Console. When you deploy a stack that matches the alarm's serviceName and stage criteria, Stacktape creates a concrete alarm for each eligible resource in that stack.
When configuring a global alarm, you can specify:
- The resource type and metric to monitor.
- The threshold for the metric.
- Automatic Slack or email notifications.
- The stacks the alarm applies to, based on
serviceNameandstage.
Global alarms only apply to stacks that are created or updated after the alarm is created. If you create a global alarm, you must run the stacktape deploy command to apply it to your existing stacks.
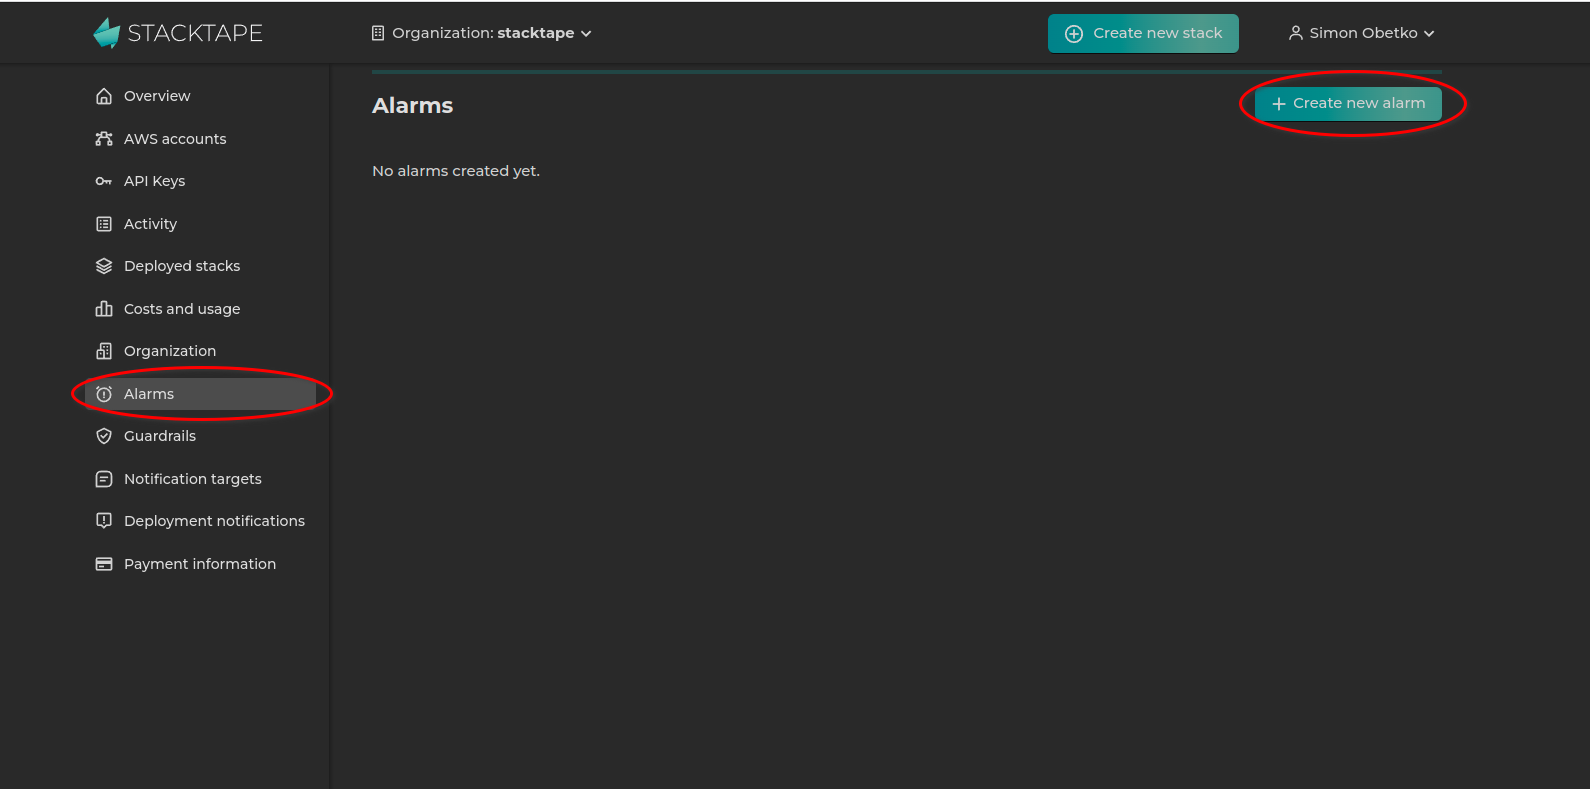
Creating a global alarm
-
Navigate to the Alarms page in the Stacktape Console and click Create new alarm.
-
Configure the alarm. The example below shows an alarm that monitors the error rate of Lambda functions and is limited to the
prodstage.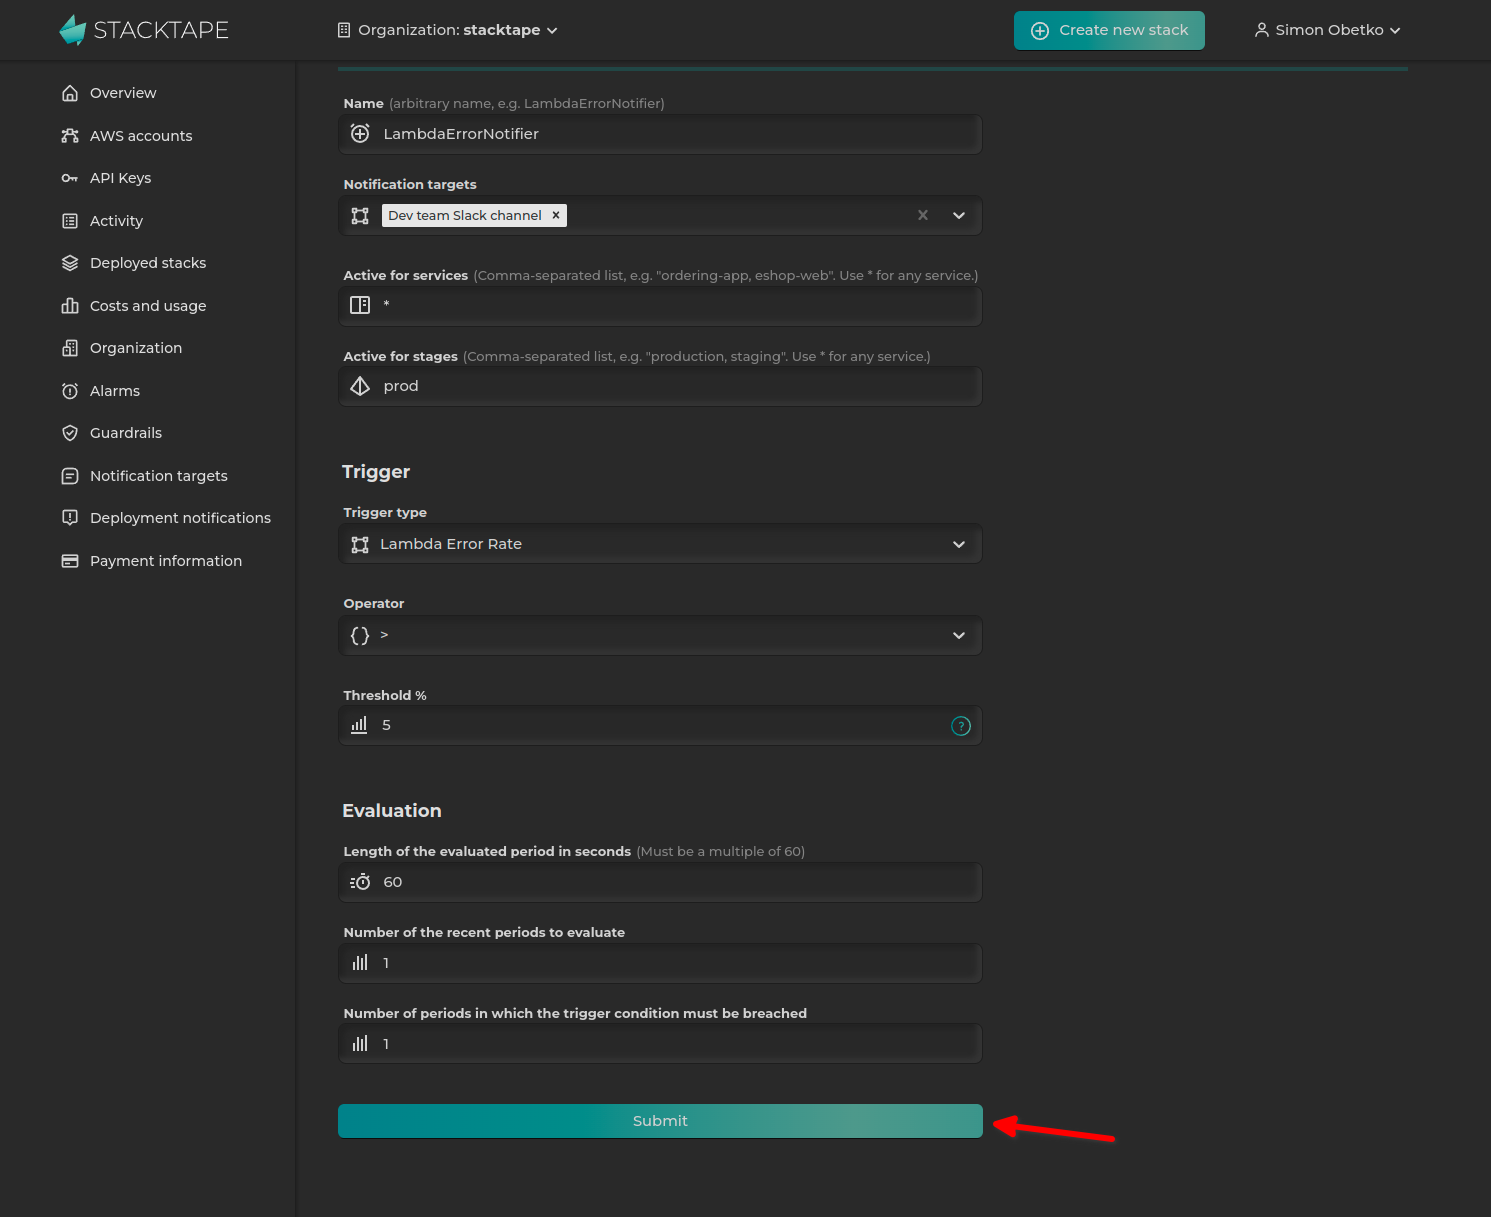
-
Deploy your stack using the
stacktape deploycommand to create the alarms.
In-config alarms
You can define alarms directly in your stacktape.yml file as a property of the resource you want to monitor.
resources:myLambdaFunction:type: functionproperties:packaging:type: stacktape-lambda-buildpackproperties:entryfilePath: 'lambdas/js-lambda.js'alarms:- trigger:type: lambda-error-rateproperties:thresholdPercent: 5notificationTargets:- type: slackproperties:conversationId: C038XXXXXXaccessToken: $Secret('slack-access-token')
An in-config alarm consists of three parts:
- Trigger: Specifies the metric to monitor.
- Notifications (optional): Defines where to send notifications when the alarm is triggered.
- Evaluation (optional): Configures the evaluation period for the monitored metric.
Trigger
The trigger specifies the metric to be monitored.
resources:myLambdaFunction:type: function# ...alarms:- trigger:type: lambda-error-rateproperties:thresholdPercent: 5
See the Trigger Types section for a list of all available alarms.
Notifications
You can configure notifications to be sent to Slack, MS Teams, or by email.
Slack:
resources:myResource:type: ...properties:# ...alarms:- trigger:# ...notificationTargets:- type: slackproperties:conversationId: C038XXXXXXaccessToken: $Secret('slack-access-token')
MS Teams:
resources:myResource:type: ...properties:# ...alarms:- trigger:# ...notificationTargets:- type: ms-teamsproperties:webhookUrl: MY_WEBHOOK_URL
Email:
resources:myResource:type: ...properties:# ...alarms:- trigger:# ...notificationTargets:- type: emailproperties:sender: alarm@company.comrecipient: support@company.com
Evaluation
The evaluation section configures the evaluation period for the monitored metric.
resources:myResource:type: ...properties:# ...alarms:- trigger:# ...evaluation:period: 200
Trigger a Lambda function on alarm
You can trigger a Lambda function when an alarm is fired. For more information, see the alarm event documentation.
Trigger types
New trigger types are added regularly. If you have a request for a new trigger, please open a GitHub issue.
Lambda Error Rate
The error rate is the percentage of Lambda invocations that result in an error. For example, a value of 1 means the alarm will trigger if more than 1% of invocations fail.
Lambda Duration
By default, the alarm triggers if the average execution time over the evaluation period is greater than the thresholdMilliseconds.
You can customize the behavior using the statistic and comparisonOperator properties.
Database Read Latency
Read latency is the average amount of time taken for a read I/O operation.
By default, the alarm triggers if the average read latency over the evaluation period is greater than the thresholdSeconds.
You can customize the behavior using the statistic and comparisonOperator properties.
Database Write Latency
Write latency is the average amount of time taken for a write I/O operation.
By default, the alarm triggers if the average write latency over the evaluation period is greater than the thresholdSeconds.
You can customize the behavior using the statistic and comparisonOperator properties.
Database CPU Utilization
By default, the alarm triggers if the average CPU utilization over the evaluation period is greater than the thresholdPercent.
You can customize the behavior using the statistic and comparisonOperator properties.
Database Free Storage
By default, the alarm triggers if the minimum available storage space over the evaluation period is lower than the thresholdMB.
You can customize the behavior using the statistic and comparisonOperator properties.
Database Free Memory
By default, the alarm triggers if the average available free memory over the evaluation period is lower than the thresholdMB.
You can customize the behavior using the statistic and comparisonOperator properties.
Database Connection Count
By default, the alarm triggers if the average number of database connections over the evaluation period is greater than the thresholdCount.
You can customize the behavior using the statistic and comparisonOperator properties.
Http Api Gateway Error Rate
The error rate is the percentage of total requests that result in a 4xx or 5xx HTTP status code. For example, a value of 5 means the alarm will trigger if more than 5% of requests result in an error.
Http Api Gateway Latency
Latency is the time from when API Gateway receives a request to when it sends a response.
By default, the alarm triggers if the average latency over the evaluation period is greater than the thresholdMilliseconds.
You can customize the behavior using the statistic and comparisonOperator properties.
Application Load Balancer Error Rate
The error rate is the percentage of total requests that result in a 4xx or 5xx HTTP status code. For example, a value of 5 means the alarm will trigger if more than 5% of requests result in an error.
Application Load Balancer Custom
The threshold will be compared against the calculated value of statistic(METRIC), where:
statisticis the function applied to the metric values collected during the evaluation period (default:avg).METRICis the chosen metric.
Available Metrics:
ActiveConnectionCount: The total number of concurrent TCP connections active from clients to the load balancer and from the load balancer to targets.AnomalousHostCount: The number of hosts detected with anomalies.ClientTLSNegotiationErrorCount: The number of TLS connections initiated by the client that did not establish a session with the load balancer due to a TLS error.ConsumedLCUs: The number of load balancer capacity units (LCU) used by your load balancer.DesyncMitigationMode_NonCompliant_Request_Count: The number of requests that do not comply with RFC 7230.DroppedInvalidHeaderRequestCount: The number of requests where the load balancer removed HTTP headers with invalid fields before routing the request.MitigatedHostCount: The number of targets under mitigation.ForwardedInvalidHeaderRequestCount: The number of requests routed by the load balancer that had HTTP headers with invalid fields.GrpcRequestCount: The number of gRPC requests processed over IPv4 and IPv6.HTTP_Fixed_Response_Count: The number of successful fixed-response actions.HTTP_Redirect_Count: The number of successful redirect actions.HTTP_Redirect_Url_Limit_Exceeded_Count: The number of redirect actions that failed because the URL in the response location header exceeded 8K.HTTPCode_ELB_3XX_Count: The number of HTTP 3XX redirection codes originating from the load balancer.HTTPCode_ELB_4XX_Count: The number of HTTP 4XX client error codes originating from the load balancer.HTTPCode_ELB_5XX_Count: The number of HTTP 5XX server error codes originating from the load balancer.HTTPCode_ELB_500_Count: The number of HTTP 500 error codes originating from the load balancer.HTTPCode_ELB_502_Count: The number of HTTP 502 error codes originating from the load balancer.HTTPCode_ELB_503_Count: The number of HTTP 503 error codes originating from the load balancer.HTTPCode_ELB_504_Count: The number of HTTP 504 error codes originating from the load balancer.IPv6ProcessedBytes: The total number of bytes processed by the load balancer over IPv6.IPv6RequestCount: The number of IPv6 requests received by the load balancer.NewConnectionCount: The total number of new TCP connections established from clients to the load balancer and from the load balancer to targets.NonStickyRequestCount: The number of requests where the load balancer chose a new target because it could not use an existing sticky session.ProcessedBytes: The total number of bytes processed by the load balancer over IPv4 and IPv6.RejectedConnectionCount: The number of connections rejected because the load balancer reached its maximum number of connections.RequestCount: The number of requests processed over IPv4 and IPv6.RuleEvaluations: The number of rules processed by the load balancer, averaged over an hour.HealthyHostCount: The number of targets that are considered healthy.HTTPCode_Target_2XX_Count: The number of HTTP 2XX response codes generated by the targets.HTTPCode_Target_3XX_Count: The number of HTTP 3XX response codes generated by the targets.HTTPCode_Target_4XX_Count: The number of HTTP 4XX response codes generated by the targets.HTTPCode_Target_5XX_Count: The number of HTTP 5XX response codes generated by the targets.RequestCountPerTarget: The average number of requests per target in a target group.TargetConnectionErrorCount: The number of connections that were not successfully established between the load balancer and a target.TargetResponseTime: The time elapsed (in seconds) from when a request leaves the load balancer until the target starts sending response headers.TargetTLSNegotiationErrorCount: The number of TLS connections initiated by the load balancer that did not establish a session with the target.UnHealthyHostCount: The number of targets that are considered unhealthy.HealthyStateDNS: The number of zones that meet the DNS healthy state requirements.HealthyStateRouting: The number of zones that meet the routing healthy state requirements.UnhealthyRoutingRequestCount: The number of requests routed using the routing failover action (fail open).UnhealthyStateDNS: The number of zones that do not meet the DNS healthy state requirements.UnhealthyStateRouting: The number of zones that do not meet the routing healthy state requirements.LambdaInternalError: The number of requests to a Lambda function that failed due to an issue internal to the load balancer or AWS Lambda.LambdaTargetProcessedBytes: The total number of bytes processed by the load balancer for requests to and responses from a Lambda function.LambdaUserError: The number of requests to a Lambda function that failed due to an issue with the Lambda function itself.ELBAuthError: The number of user authentications that could not be completed due to an internal error.ELBAuthFailure: The number of user authentications that could not be completed because the IdP denied access.ELBAuthLatency: The time elapsed (in milliseconds) to query the IdP for the ID token and user info.ELBAuthRefreshTokenSuccess: The number of times the load balancer successfully refreshed user claims using a refresh token.ELBAuthSuccess: The number of successful authentication actions.ELBAuthUserClaimsSizeExceeded: The number of times a configured IdP returned user claims that exceeded 11K bytes in size.
Sqs Queue Received Messages
Triggers an alarm when the number of messages received from an SQS queue crosses the defined threshold.
By default, it's triggered if the average number of received messages (based on the NumberOfMessagesReceived metric) over the evaluation period is greater than the thresholdCount.
You can customize the behavior using the statistic and comparisonOperator properties.
Sqs Queue Not Empty
Triggers an alarm if the SQS queue is not empty. A queue is considered empty if all of the following metrics are 0 for the evaluation period:
ApproximateNumberOfMessagesVisibleApproximateNumberOfMessagesNotVisibleNumberOfMessagesReceivedNumberOfMessagesSent